Once the algorithm is finalized, these results will be detailed and will update automatically. For now, here are results gathered during October 2011, following the first 3 weeks of beta testing:
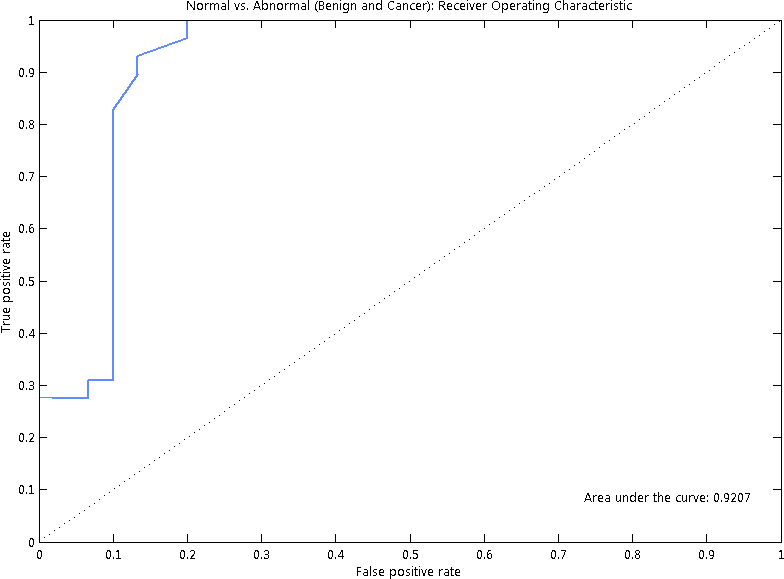
Each point on this curve plots a tradeoff between detection rate (sensitivity) and false positive rate (1 - specificity). The higher the curve rises, the better the performance, particularly in the top left corner of the graph. The dashed diagonal line in the middle represents the performance of a random guess.
In practice, our algorithm has detected 97% of abnormal images while mistaking 4% of normal images for abnormalities in a testing set of 60 images (30 normal, 30 abnormal). It is important to note that all of these images came from one scanner; therefore, the accuracy in practice may be slightly lower due to inter-scanner calibration differences.
As seen in